Cloud waste, environmental impact, and downtime cost enterprises trillions annually. With up to 30% of cloud spending wasted and outages costing $1.7 million per hour, the scale of the problem is staggering. For the full data behind the inefficiency crisis, see The Hidden Cost of IT Inefficiency.
DeepXplore’s Approach: Intelligence Over Investigation
DeepXplore takes a fundamentally different approach to incident resolution. Instead of asking engineers to manually correlate logs, traces, and metrics across dozens of dashboards, DeepXplore’s Root Cause Analysis pinpoints the source of anomalies in seconds rather than hours. Investigations run against an organization knowledge graph—a structured map of repositories, microservices, dependencies, and runtime topology—and combine telemetry, knowledge, and change systems with timeline correlation so agents know blast radius before they fetch evidence.
When an anomaly is detected, DeepXplore reconstructs the full context of what changed and why behaviour degraded. It ingests deployment events, configuration changes, infrastructure scaling actions, and code commits, then maps them against the timeline of performance deviation and the services in your estate graph. The result is a set of clear, ranked explanations—not a wall of correlated alerts, but a prioritised list of probable causes with supporting evidence, delivered directly to the team that owns the affected service.
This eliminates the war-room dynamic entirely. There is no need to assemble engineers from five teams at 3:00 AM to debate whether the problem is in the network, the database, or the application layer. DeepXplore has already narrowed the field and presented its findings. Teams bring their data; DeepXplore brings the intelligence—freeing senior engineers to build product, not chase incidents.
Incident Resolution: Traditional vs. DeepXplore
From Reactive to Proactive
The value extends beyond faster incident response. By continuously analysing performance baselines and change events, DeepXplore identifies degradation patterns before they escalate into outages. A gradual increase in garbage-collection pause times after a JDK upgrade, a slow rise in connection-pool exhaustion following a configuration change, a subtle throughput decline correlated with a new feature flag—these are precisely the signals that manual monitoring misses and that war rooms are too late to catch. With DeepXplore, the root cause is identified and surfaced while there is still time to act preventively, transforming incident management from a reactive firefight into a proactive engineering discipline.
How It Works: Composer and Parallel Specialists
Traditional incident tooling expects engineers to manually navigate between metrics dashboards, change logs, and alert systems—piecing together a timeline from fragmented data scattered across a dozen interfaces. DeepXplore inverts this model. A composer sits at the center of a control loop: it reviews the investigation goal and what prior agents have produced, decides which specialists to run next, waits for parallel work to finish, then re-evaluates until goals are met or a bounded iteration limit is reached. Work runs on managed executors in DeepXplore’s platform—not on individual laptops—so SRE and platform teams share the same evidence trail.
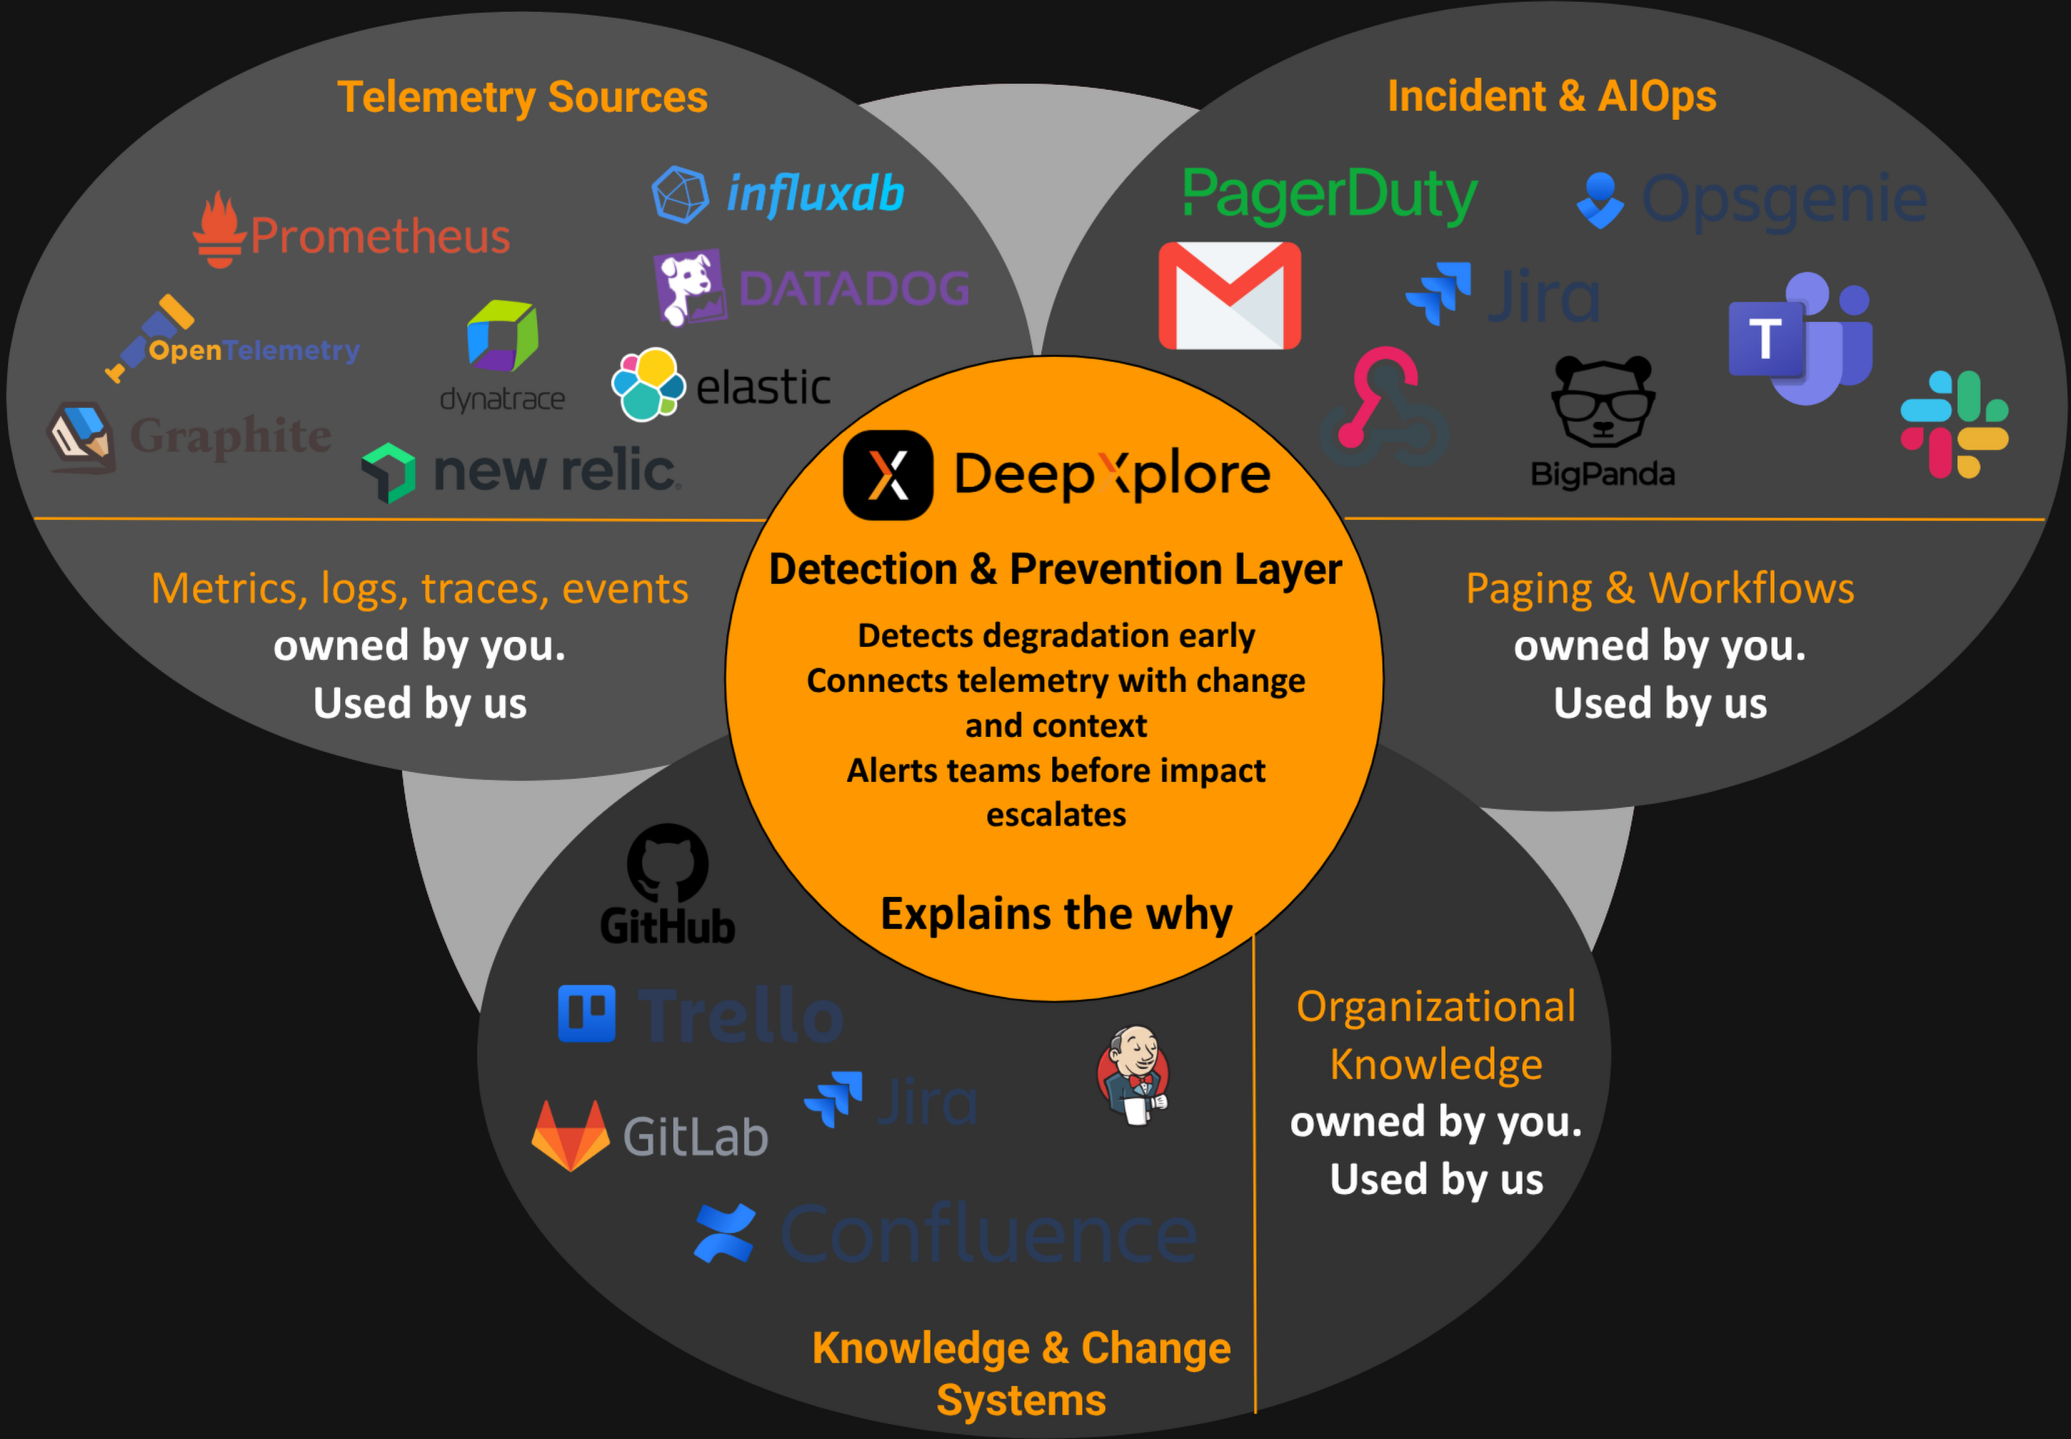
Before agents investigate, they query your organization knowledge graph to understand which repos own affected services, how dependencies connect, and where runtime manifests deploy them. When an anomaly is detected, the composer dispatches specialists across three categories of systems that together capture the full operational context of your environment:
Telemetry Sources
Agents connect to your metrics, logs, traces, and event stores—systems like GreptimeDB, Prometheus, InfluxDB, Datadog, OpenTelemetry, Elastic, and Graphite. These agents ingest the raw performance signals: response-time distributions, error rates, CPU/memory utilisation, garbage-collection behaviour, and throughput anomalies. Rather than scanning entire dashboards, each specialist is given a targeted investigation objective aligned with the detected anomaly.
Knowledge & Change Systems
A second wave of agents queries your code repositories and project-management tools—GitHub, GitLab, Jenkins, Confluence, Jira, and Trello. These agents reconstruct what changed and when: recent commits, merged pull requests, deployment pipelines, infrastructure-as-code modifications, and any associated documentation or ticket context. This is the change layer that traditional monitoring completely ignores.
Incident & AIOps
A third group of agents connects to your alerting and incident-management systems—PagerDuty, OpsGenie, Jira, BigPanda, Slack, Teams, Email, and Webhooks. These agents gather the operational context: active incidents, previous alerts on the same service, escalation history, and on-call assignments. This prevents duplicate investigations and surfaces patterns across recurring issues. Critically, this integration is bidirectional: when DeepXplore detects something critical, it alerts your teams through the same channels they already use—pushing notifications to Slack, creating tickets in Jira, triggering PagerDuty escalations, or firing webhooks into your automation pipelines. There is no new tool to monitor; alerts arrive where your teams are already looking.
The Composer and Bounded Refinement
After each round of parallel specialists, the composer merges outputs and correlates them into a unified conclusion. It aligns the telemetry timeline with the change timeline and the incident timeline, looking for causal relationships rather than mere coincidences. If evidence is incomplete, the composer can enqueue another round of specialists. The output is a ranked list of probable root causes with supporting evidence from every data source—delivered as a clear, actionable report that any engineer can act on immediately without convening a war room.
Same Engine as DeepXplore Code
RCA and DeepXplore Code share the same platform principles: organization knowledge graph, composer-driven orchestration, telemetry and change-system integration, and bounded refinement loops. When your runbook allows it, ranked RCA findings can hand off to DeepXplore Code for evidence-backed implementation, tests, and pull requests. For a deeper walkthrough of the agentic architecture, see our DeepXplore Code agentic engineering article.